 |
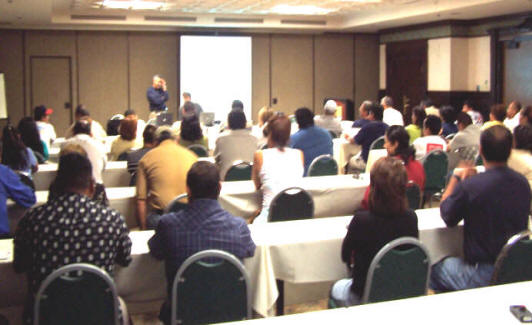
The most
commonly employed method for finding out what songs to play on the
radio is to conduct an Auditorium Music Test (AMT) where a precisely
recruited group of listeners or potential listeners is assembled in
a meeting room.
With time, the traditional music
test will be phased out to take
advantage of new technology using
computers and portable devices.
For examples of the kind of
technology being developed for
on-line and mobile testing, visit
Online Testing with the "Dial"
But for the most part, a "music
test" means the kind of procedure that you
see described here. |
|
Technology for
better testing. |
|
 |
Although there is advanced
technology that permits music
testing to be done online, there are
issues such as lack of supervision,
misunderstanding of instructions,
"ringers" and failure to complete
the test that affect this
alternative. This is the same problem
Arbitron has met in trying to administer
diary surveys via the web and for which
reason radio surveys online are not done...
yet.
Nonetheless, we expect interactive
online and smartphone testing to
become the standard in the near
future as recruit and supervision
controls are perfected.
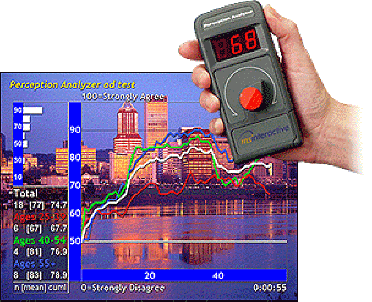
Click
here or on the graphic
to visit the website of the major
provider of the dial technology to
companies of all kinds, ranging from
radio stations to MTV and Fox News
|
|
A real Music Test... |
|
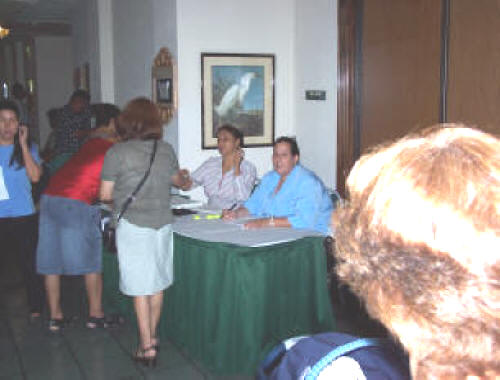 |
As the listeners
arrive, each is checked in outside the test
room to make sure the people who were
carefully recruited the weeks before the
test are the ones who check in. The recruit
process generally tries to create a sample
that accurately represents the composition
of the core audience of a station or a
format. Recruiting techniques also try to
mirror Arbitron recruit methods.
Recruiting is generally done by
professional research recruiters who
specialize in accurately delivering
the client's specification.
These same recruiting firms also
provide respondents for major
consumer goods manufacturers as well
as to retailers and other companies
interested in having precise
consumer feedback. Such a firm is
compensated based on the turnout of
qualified respondents. The
respondent may earn from $50 to over
$100 for a session that lasts about
3 hours. |
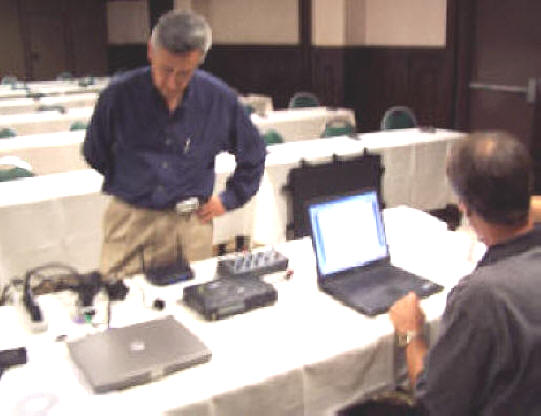 |
Here are Tom Owens and Ricardo Maza-nares
of Hispanic Broadcasting's in-house research
division
setting up for a music test.
While this example is an in-house
research division, the identity of
the station conducting the test is
not revealed to the participants
as doing so biases the results.
This photo shows the
preparing of the computer gear which will
accept listener input from the dials (you
can see them on the table) and feed them to
a laptop where each score is cross tabulated
with the individual who registers it. |
At the music
test, listeners spend about two hours and they hear snippets,
generally around 8 seconds in length, of songs that a station
plays or might play. These small samples of songs have been
time-proven to be adequate for listeners to identify and give an
opinion on each song.
In the dial-based environment, about
80% of respondents have scored a
song within the first 5 seconds of a
"hook." Playing any more of a song
increases fatigue, and does not
change scores at all. |
Some research companies continue
to successfully use "paper tests"
where respondents mark their score
on a test sheet. These sheets
are scanned and read automatically
to produce the scores. |
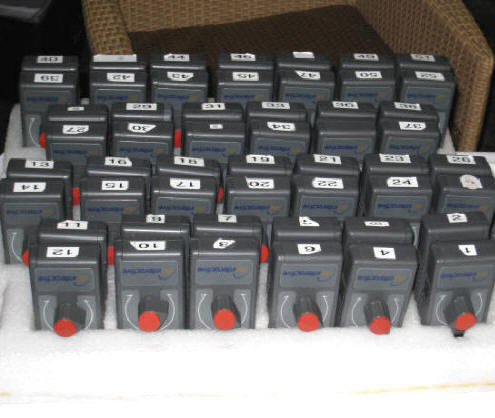 |
A set of dials ready to be placed on the
tables in preparation for the test. If the dials look a bit
familiar, they are the same ones used by several of the news
networks to do those on-air focus groups about elections, candidates
and issues.
One of the objectives of a music
test is finding out how much
listeners want to hear a song "if it
were played on the radio today." The
dial is an easy way for listeners to
express an opinion; up is good, down
is bad. |
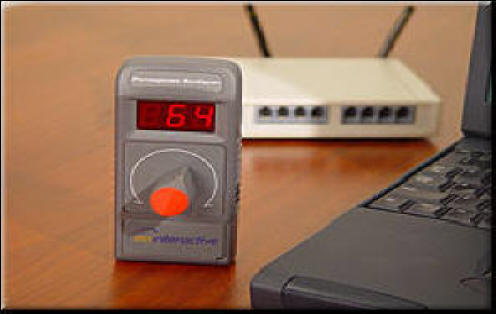 |
This view
shows the dial which takes individual
participant input and feeds it to the
computer via a two way transmitter, called a
"console".
Scores are always tied to the dial holder,
so that data on thier age, gender and radio
listening habits can be applied to the
results.
As a test begins, respondents "dial in"
their age, gender and answers to certain
screener questions in response to the
moderator's questions. |
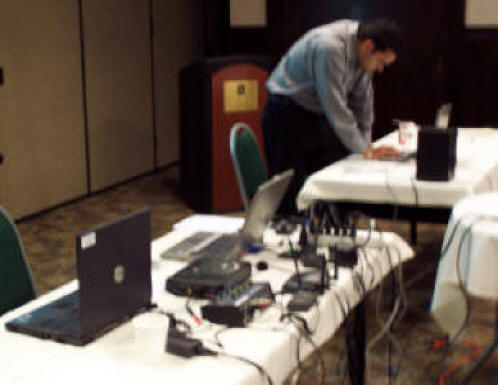 |
Almost ready
for the participants enter the test room. Ismar
Santacruz does a final check-up on the
equipment, now ready for testing hundreds of
songs as well as snippets of morning shows.
Additionally, the dial is the
perfect instrument for the recording
of responses to perceptual questions
about station images and features.
|
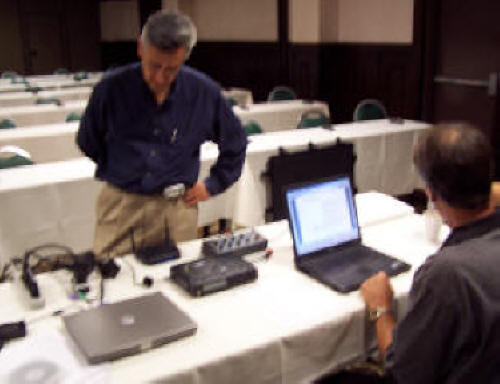 |
Session moderator Manzanares
does a pre-session check on the test
gear and list of songs and questions
for the participants. It is
important that the moderator of a
test be personable and pleasant, as
listening to 500 to 600 song clips
can be tedious.
To negate any fatigue factor, each
of the test sessions plays the song
sets in a different order so the
scores "average out." |
|
Starting the test |
|
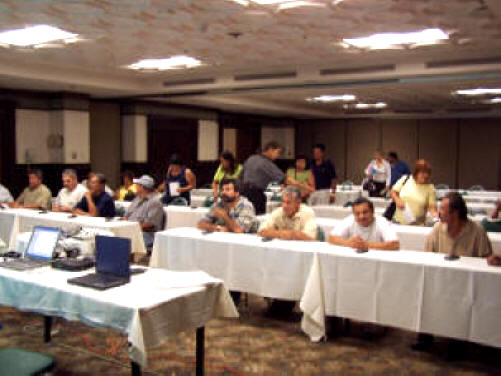 |
The listeners are guided into
the test room. Groups that may have
formed to chat prior to the test are
broken up by a process of sending
every other person to different
sides of the room. This helps
minimize distractions. Right
after this step, everyone is asked
to turn off their cellular phones!
The first thing checked at the
beginning of a test is whether the
respondents are within the
specifications of the test based on
things like station usage, amount of
radio usage, etc. |
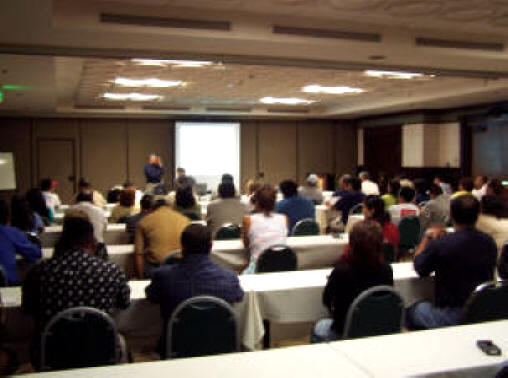 |
This view
is looking
towards the front of the test room, where a screen will supplement
the verbal instructions to the panel taking the test. By
providing both visiual and spoken
instructions, the degree of
understanding of each question is
enhanced and it provides sensory
variety for the participants. |
 |
Ricardo
checks the microphone and starts the music
test. Groups are generally limited to
about 60 people, which allows for a personal
experience for the participant. Often, after
a test is over, a station DJ will give out
Tshirts or mugs and thank the participants
for helping to create the best radio
programming possible; this can be a pleasant
surprise for participants since they don't
know until then what station is doing the
research. |
 |
The advantage of the dial is that it
works just like the volume control
on any electronic device.... you
"dial it up" if you like it and turn
it down if you do not. The procedure
is intuitive and easy. |
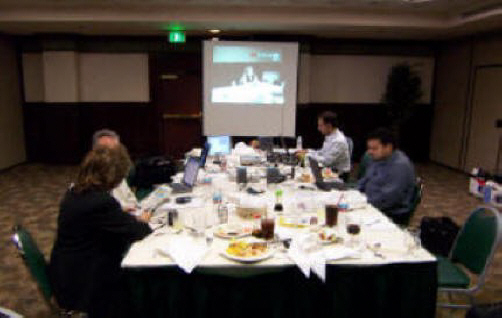 |
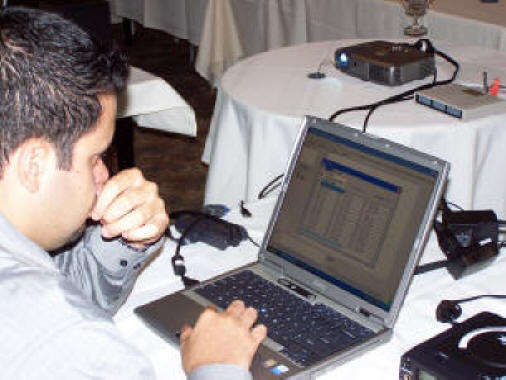
Since the
test is done with real-time computer
processing, an EKG-like graph of listener
reaction can be seen on a monitor in a
separate room. Station staff can see the
instant results for each song so they get a
"feel" for the overall music styles. The
graph on screen can show listeners by age,
sex, station preference and many other
criteria.
Here is Recuerdo Network's (LA, San
Francisco, Fresno, San Diego, Phoenix, Las
Vegas, Chicago, Houston, Dallas, San
Antonio, Austin and McAllen) Amalia Gonzalez
observing a two-night, 1350 song test in
2009. |
|
Tabulating the Results |
|
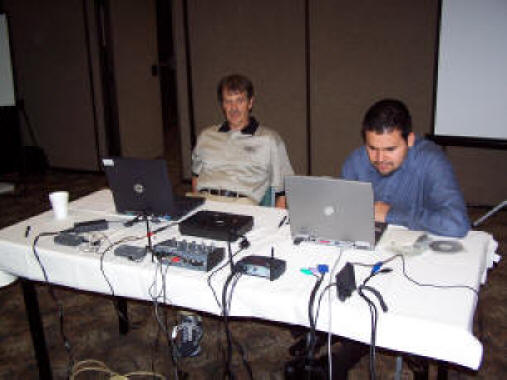 |
The test is over.
Tom Owens and Ismar SantaCruz
process the data the same evening,
making it possible to present the
results the next day to the station
programming staff.
Since the raw data is collected
electronically, it is possible to
produce an almost-infinite variety
of reports to suit the station's
needs, with data columns based on
age, gender, amount of listening,
morning show usage, and even deeper
analysis based on cluster/factor
analysis . |
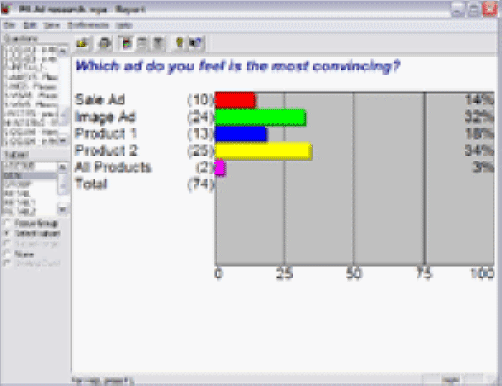 |
Once a test
is completed, the reports that may be printed or viewable in special
software are a guide to station programmers as to which songs to
play and how often.
A sample view of the results on a
perceptual question looks like this.
Different sorts by age and gender
are possible. |
 |
It's up to
the station to determine the data that is most important to
implement the test. Software permits viewing many, many columns of
data, by age groupings, station preferences, and even with cluster
analysis applied. This allows the consideration of many factors in
programming, all at once, to insure that every hour is balanced for
all subsets of the audience. So the processing of the data provides
as many different data views as may
be needed. |
|
|
|
 |
Results are
shown to the client station in a
full list with scores for different
groups like men, women, younger
half, older half, heavy listeners,
light ones, and cluster analysis
derived groupings.
In this example, Green means
"great", blue means "good", yellow
means "marginal" and orange and red
mean "bad" and "terrible." |
 |
As the
client station looks deep in the
list (This is an older CHR
test) we see that scores get very
low very fast and certain groups
fall even lower on specific songs.
This is the classic explanation for
why stations do not have longer
playlists: listener consensus limits
the total number of playable songs. |
|
Electronic Testing |
|
 |
The first
AMT's in the 70's were done with
paper and pencil, much like a
college admission test. Results were
tabulated using scanners and
delivered several days after the
test.
The advantage
of electronic testing is that the results
are ready within a few hours of the test,
and ready for the station staff to use to
provide the music and programs the listeners
just said they wanted!
In fact, the results can be watched
on-screen in real time to get a real
feel for audience reaction and
response. |