 |
Jim Duncan's Market-by-Market
Radio Ratings History 1975-2003
|
|
Arbitron Radio Market Ratings Reports from
1975 to 2004 in Tabular Form |
|
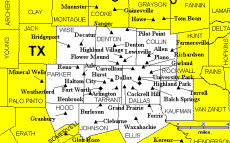
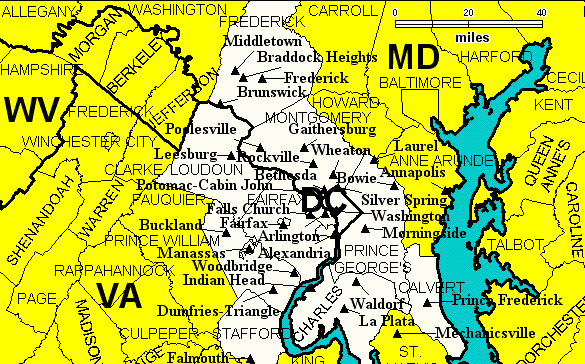
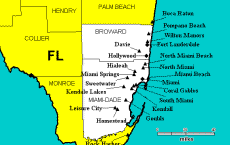
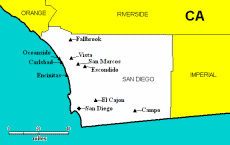
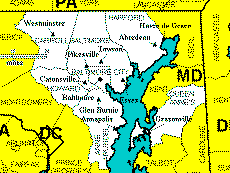
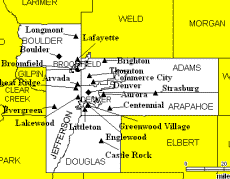
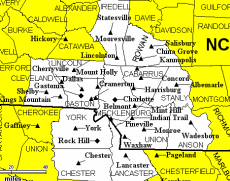
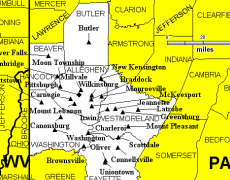
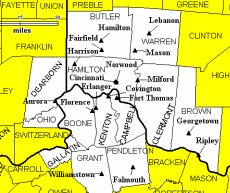
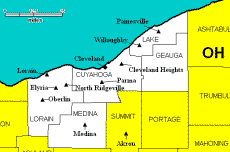
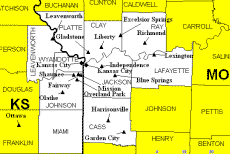
Arbitron Metro Survey Area
Market Maps










 |
|
# |
Markets in
Blue
do not have sufficient
data for a historical trending
RED
markets have a 28 year history
- Click to View |
|
1 |
New York, NY |
15,345,000 |
|
2 |
Los Angeles,
CA |
10,902,400 |
|
3 |
Chicago, IL |
7,784,400 |
|
4 |
San Francisco,
CA |
5,969,400 |
|
5 |
Dallas-Ft.
Worth, TX |
4,973,000 |
|
6 |
Houston-Galveston, TX |
4,639,000 |
|
7 |
Philadelphia,
PA |
4,350,000 |
|
8 |
Atlanta, GA |
4,267,500 |
|
9 |
Washington, DC |
4,210,000 |
|
10 |
Boston, MA |
3,874,600 |
|
11 |
Detroit, MI |
3,866,500 |
|
12 |
Miami-Ft.
Lauderdale. FL |
3,538,400 |
|
13 |
Puerto Rico (no history) |
3,328,500 |
|
14 |
Seattle-Tacoma, WA |
3,328,100 |
|
15 |
Phoenix, AZ |
3,173,200 |
|
16 |
Minneapolis-St. Paul, MN |
2,683,000 |
|
17 |
San Diego, CA |
2,515,100 |
|
18 |
Nassau-Suffolk
(Long Island), NY |
2,359,300 |
|
19 |
Tampa-St.
Petersburg-Clearwater, FL |
2,350,000 |
|
20 |
St. Louis, MO |
2,308,400 |
|
21 |
Baltimore, MD |
2,255,100 |
|
22 |
Denver-Boulder, CO |
2,244,300 |
|
23 |
Portland, OR |
2,049,600 |
|
24 |
Pittsburgh, PA |
1,986,600 |
|
25 |
Charlotte, NC-SC |
1,886,100 |
|
26 |
Riverside-San
Bernardino, CA |
1,829,200 |
|
27 |
Sacramento, CA |
1,805,200 |
|
28 |
Cleveland, OH |
1,782,400 |
|
29 |
Cincinnati, OH |
1,751,400 |
|
30 |
San Antonio,
TX |
1,626,500 |
|
31 |
Salt Lake
City, UT |
1,621,900 |
|
32 |
Kansas City,
MO-KS |
1,592,800 |
|
33 |
Las Vegas, NV |
1,541,900 |
|
34 |
Orlando, FL |
1,479,900 |
|
35 |
San Jose, CA |
1,465,400 |
|
36 |
Milwaukee-Racine, WI |
1,431,300 |
|
37 |
Columbus, OH |
1,427,000 |
|
38 |
Middlesex-Somerset-Union, NJ |
1,378,800 |
|
39 |
Providence,
RI |
1,376,500 |
|
40 |
Indianapolis,
IN |
1,350,900 |
|
41 |
Norfolk-Virginia Beach-Newport News,
VA |
1,327,700 |
|
42 |
Austin, TX |
1,309,500 |
|
43 |
Raleigh-Durham, NC |
1,230,300 |
|
44 |
Nashville, TN |
1,182,900 |
|
45 |
Greensboro-Winston-Salem-High Point,
NC |
1,154,400 |
|
46 |
West Palm
Beach-Boca Raton, FL |
1,116,400 |
|
47 |
Jacksonville,
FL |
1,106,400 |
|
48 |
Oklahoma City,
OK |
1,091,300 |
|
49 |
Memphis, TN |
1,072,800 |
|
50 |
Hartford-New
Britain, CT |
1,048,200 |
|
51 |
Monmouth-Ocean, NJ (no history) |
1,020,500 |
|
52 |
Buffalo-Niagara Falls, NY |
971,400 |
|
53 |
Louisville, KY |
942,300 |
|
54 |
Rochester, NY |
934,100 |
|
55 |
New Orleans,
LA |
929,300 |
|
56 |
Richmond, VA |
924,700 |
|
57 |
Birmingham, AL |
884,600 |
|
58 |
McAllen-Brownsville-Harlingen, TX |
856,100 |
|
59 |
Greenville-Spartanburg, SC |
845,100 |
|
60 |
Dayton, OH |
829,000 |
|
61 |
Tucson, AZ |
824,400 |
|
62 |
Ft.
Myers-Naples, FL |
810,800 |
|
63 |
Albany-Schenectady-Troy, NY |
781,600 |
|
64 |
Honolulu, HI |
771,100 |
|
65 |
Tulsa, OK |
744,600 |
|
66 |
Fresno, CA |
734,600 |
|
67 |
Grand Rapids,
MI |
711,700 |
|
68 |
Allentown-Bethlehem, PA |
698,700 |
|
69 |
Albuquerque,
NM |
691,300 |
|
70 |
Wilkes
Barre-Scranton, PA |
687,100 |
|
71 |
Knoxville, TN |
658,600 |
|
72 |
Omaha-Council
Bluffs, NE-IA |
625,400 |
|
73 |
Sarasota-Bradenton, FL |
616,200 |
|
74 |
Akron, OH |
598,800 |
|
75 |
Wilmington, DE |
592,900 |
|
76 |
El Paso, TX |
592,700 |
|
77 |
Bakersfield,
CA |
584,100 |
|
78 |
Harrisburg-Lebanon-Carlisle, PA |
566,200 |
|
79 |
Stockton, CA (no history) |
561,400 |
|
80 |
Baton Rouge,
LA |
557,300 |
|
81 |
Monterey-Salinas-Santa Cruz, CA |
556,900 |
|
82 |
Syracuse, NY |
554,800 |
|
83 |
Gainesville-Ocala, FL (no
history) |
541,600 |
|
84 |
Little Rock,
AR |
532,100 |
|
85 |
Daytona
Beach, FL (no history) |
529,300 |
|
86 |
Springfield,
MA |
528,500 |
|
87 |
Charleston, SC |
518,400 |
|
88 |
Toledo, OH |
514,900 |
|
89 |
Greenville-New
Bern-Jacksonville, NC |
510,300 |
|
90 |
Columbia, SC |
507,500 |
|
91 |
Des Moines, IA |
506,100 |
|
92 |
Spokane, WA |
502,600 |
|
93 |
Mobile, AL |
487,600 |
|
94 |
Lakeland-Winter Haven, FL |
485,800 |
|
95 |
Colorado
Springs, CO |
480,500 |
|
96 |
Ft.
Pierce-Stuart-Vero Beach, FL
(no history) |
479,100 |
|
97 |
Melbourne-Titusville-Cocoa, FL (no
history) |
478,900 |
|
98 |
Wichita, KS |
473,000 |
|
99 |
Madison, WI |
471,500 |
|
100 |
Visalia-Tulare-Hanford, CA |
463,900 |
|
101 |
Johnson
City-Kingsport-
Bristol, TN-VA |
459,800 |
|
102 |
Boise, ID |
458,600 |
|
103 |
York, PA |
454,000 |
|
104 |
Lafayette, LA |
449,500 |
|
105 |
Lexington-Fayette, KY |
445,700 |
|
106 |
Ft. Wayne, IN |
432,700 |
|
107 |
Chattanooga,
TN |
429,500 |
|
108 |
Modesto, CA |
427,800 |
|
109 |
Huntsville, AL |
427,300 |
|
110 |
Augusta, GA |
423,600 |
|
111 |
Morristown,
NJ (no history) |
418,600 |
|
112 |
Worcester, MA |
418,300 |
|
113 |
Lancaster, PA |
418,000 |
|
114 |
New Haven, CT |
417,100 |
|
115 |
Roanoke-Lynchburg, VA |
415,200 |
|
116 |
Portsmouth-Dover-Rochester, NH |
413,900 |
|
117 |
Oxnard-Ventura, CA |
406,600 |
|
118 |
Santa Rosa,
CA (no history) |
405,700 |
|
119 |
Youngstown-Warren, OH |
402,200 |
|
120 |
Victor
Valley, CA (no history) |
394,600 |
|
121 |
Jackson, MS |
394,300 |
|
122 |
Bridgeport, CT |
392,500 |
|
123 |
Ft.
Collins-Greeley, CO (no
history) |
388,200 |
|
124 |
Reno, NV |
387,200 |
|
125 |
Lansing-East
Lansing, MI |
386,500 |
|
126 |
Pensacola, FL |
380,400 |
|
127 |
Flint, MI |
366,800 |
|
128 |
Canton, OH |
350,000 |
|
129 |
Reading, PA (no history) |
347,000 |
|
130 |
Fayetteville,
NC |
344,900 |
|
131 |
Shreveport, LA |
337,800 |
|
132 |
Saginaw-Bay
City-Midland, MI |
336,400 |
|
133 |
Palm
Springs, CA (no history) |
332,900 |
|
134 |
Fayetteville (North West Arkansas),
AR |
331,000 |
|
135 |
Appleton-Oshkosh, WI |
326,400 |
|
136 |
Corpus
Christi, TX |
321,100 |
|
137 |
Burlington-Plattsburgh, VT-NY
(no history) |
319,100 |
|
138 |
Beaumont-Port Arthur, TX (no
history) |
317,900 |
|
139 |
Newburgh-Middletown, NY (Mid Hudson
Valley) |
317,600 |
|
140 |
Springfield,
MO |
315,900 |
|
141 |
Atlantic
City-Cape May, NJ |
315,700 |
|
142 |
Trenton, NJ (no history) |
313,500 |
|
143 |
Salisbury-Ocean City, MD (no
history) |
306,200 |
|
144 |
Quad Cities
(Davenport-Rock Island-Moline),
IA-IL |
306,100 |
|
145 |
Tyler-Longview, TX (no
history) |
301,400 |
|
146 |
Stamford-Norwalk, CT (no
history) |
301,300 |
|
147 |
Flagstaff-Prescott, AZ (no
history) |
299,100 |
|
148 |
Eugene-Springfield, OR |
298,500 |
|
149 |
Ann Arbor,
MI |
297,800 |
|
150 |
Peoria, IL |
297,200 |
|
151 |
Rockford, IL |
296,500 |
|
152 |
Fredericksburg, VA (no
history) |
296,400 |
|
153 |
Montgomery, AL |
296,200 |
|
154 |
Biloxi-Gulfport-Pascagoula, MS
(no history) |
293,400 |
|
155 |
Macon, GA |
280,700 |
|
156 |
Killeen-Temple, TX (no
history) |
275,400 |
|
157 |
Savannah, GA |
272,200 |
|
158 |
Huntington-Ashland, WV-KY |
269,100 |
|
159 |
Myrtle
Beach, SC (no history) |
268,500 |
|
160 |
Asheville, NC |
262,100 |
|
161 |
Evansville, IN |
258,200 |
|
162 |
Utica-Rome, NY |
257,100 |
|
163 |
Poughkeepsie, NY (no history) |
255,200 |
|
164 |
Tallahassee,
FL |
250,000 |
|
165 |
Wilmington, NC |
249,900 |
|
166 |
Hagerstown-Chambersburg-Waynesboro,
MD-PA |
247,600 |
|
167 |
Portland, ME |
239,800 |
|
168 |
Erie, PA |
237,800 |
|
169 |
Concord
(Lakes Region), NH (no
history) |
237,700 |
|
170 |
Wausau-Stevens Point, WI (Central
WI) |
237,600 |
|
171 |
Anchorage, AK |
233,400 |
|
172 |
San Luis
Obispo, CA (no history) |
231,300 |
|
173 |
Ft. Smith,
AR (no history) |
228,900 |
|
174 |
Lincoln, NE |
228,000 |
|
175 |
Wenatchee,
WA (no history) |
226,300 |
|
176 |
Morgantown-Clarksburg-Fairmont, WV |
225,800 |
|
177 |
New London,
CT (no history) |
224,900 |
|
178 |
New
Bedford-Fall River, MA (no history) |
222,000 |
|
179 |
South Bend,
IN (no history) |
221,400 |
|
180 |
Merced, CA (no history) |
217,900 |
|
181 |
Lebanon-Rutland-White River
Junction, NH-VT |
214,800 |
|
182 |
Binghamton, NY |
214,200 |
|
183 |
Charleston, WV |
212,100 |
|
184 |
Lubbock, TX |
211,900 |
|
185 |
Columbus, GA |
210,300 |
|
186 |
Odessa-Midland, TX (no history) |
205,500 |
|
187 |
Green Bay, WI |
204,300 |
|
188 |
Kalamazoo, MI |
203,800 |
|
189 |
Tupelo, MS (no history) |
201,600 |
|
190 |
Manchester, NH |
199,800 |
|
191 |
Cape Cod,
MA (no history) |
199,100 |
|
192 |
Dothan, AL (no history) |
198,500 |
|
193 |
Traverse
City-Petoskey, MI (no history) |
197,600 |
|
194 |
Topeka, KS |
194,300 |
|
195 |
Amarillo,
TX (no history) |
193,900 |
|
196 |
Tri-Cities,
WA (Richland-Kennewick-Pasco), WA |
191,500 |
|
197 |
Danbury, CT (no history) |
190,000 |
|
198 |
Chico, CA (no history) |
189,800 |
|
198 |
Frederick,
MD (no history) |
189,400 |
|
200 |
Waco, TX |
189,200 |
|
201 |
Yakima, WA |
18,1008 |
|
202 |
Rocky
Mount-Wilson, NC |
187,700 |
|
203 |
Salina-Manhattan, KS |
182,700 |
|
204 |
Laredo, TX |
178,700 |
|
205 |
Bend, OR |
176,000 |
|
206 |
Duluth-Superior, MN-WI |
175,400 |
|
207 |
Bowling
Green, KY |
175,100 |
|
208 |
Santa
Maria-Lompoc, CA |
174,600 |
|
209 |
Medford-Ashland, OR |
174,300 |
|
210 |
Terre Haute,
IN |
174,100 |
|
211 |
Clarksville-Hopkinsville, TN-KY |
172,100 |
|
212 |
Cedar Rapids,
IA |
172,000 |
|
213 |
Santa
Barbara, CA |
171,100 |
|
214 |
Muncie-Marion, IN |
168,700 |
|
215 |
Florence,
SC |
167,600 |
|
216 |
Hilton
Head, SC |
167,500 |
|
217 |
Sunbury-Selinsgrove-Lewisburg, PA |
167,100 |
|
218 |
St. Cloud,
MN |
167,000 |
|
219 |
Olean, NY |
165,700 |
|
220 |
Bangor, ME |
163,300 |
|
220 |
Bangor, ME |
163,300 |
|
220 |
Fargo-Moorhead, ND-MN |
163,300 |
|
222 |
Winchester,
VA |
163,200 |
|
223 |
Las Cruces,
NM |
163,000 |
|
224 |
Alexandria,
LA |
161,400 |
|
225 |
Champaign,
IL |
161,300 |
|
226 |
Elmira-Corning, NY |
159,400 |
|
227 |
Laurel-Hattiesburg, MS |
158,900 |
|
228 |
Redding, CA |
158,500 |
|
229 |
Ft. Walton
Beach, FL |
157,400 |
|
230 |
La Crosse,
WI |
156,600 |
|
231 |
Lake
Charles, LA |
153,600 |
|
232 |
Rochester,
MN |
152,900 |
|
233 |
Charlottesville, VA |
152,600 |
|
234 |
Tuscaloosa,
AL |
147,600 |
|
235 |
Muskegon,
MI |
147,200 |
|
236 |
Twin Falls
(Sun Valley), ID |
145,700 |
|
237 |
Joplin, MO |
143,000 |
|
238 |
Santa Fe,
NM |
142,700 |
|
239 |
Dubuque, IA |
142,600 |
|
240 |
Panama
City, FL |
141,500 |
|
241 |
Marion-Carbondale (Southern IL), IL |
140,500 |
|
242 |
Bloomington, IL |
139,300 |
|
243 |
Bryan-College Station, TX |
137,300 |
|
244 |
Eau Claire,
WI |
136,700 |
|
245 |
Pittsburg,
KS (Southeast Kansas) |
135,900 |
|
246 |
Lafayette,
IN |
135,600 |
|
247 |
Abilene, TX |
132,700 |
|
248 |
LaSalle-Peru, IL |
131,700 |
|
249 |
Sussex, NJ |
131,600 |
|
250 |
Waterloo-Cedar
Falls, IA |
129,900 |
|
251 |
Pueblo, CO |
129,700 |
|
252 |
Wheeling,
WV |
128,300 |
|
253 |
Lima, OH |
127,800 |
|
254 |
Lufkin-Nacogdoches, TX |
127,600 |
|
255 |
Columbia,
MO |
127,500 |
|
255 |
Parkersburg-Marietta, WV-OH |
127,500 |
|
257 |
State
College, PA |
126,500 |
|
258 |
Monroe, LA |
124,100 |
|
259 |
Florence-Muscle Shoals, AL |
123,900 |
|
260 |
Billings,
MT |
119,900 |
|
261 |
Kalispell-Flathead Valley, MT |
118,100 |
|
262 |
Hamptons-Riverhead, NY |
117,700 |
|
263 |
Grand
Junction, CO |
117,000 |
|
264 |
Battle
Creek, MI |
115,300 |
|
265 |
Texarkana,
TX-AR |
115,200 |
|
266 |
Wichita
Falls, TX |
112,400 |
|
267 |
Grand
Island-Kearney, NE |
112,200 |
|
268 |
Montpelier-Barre-St. Johnsbury, VT |
109,900 |
|
269 |
Altoona, PA |
109,000 |
|
270 |
Augusta-Waterville, ME |
106,800 |
|
271 |
Albany, GA |
106,300 |
|
272 |
Valdosta,
GA |
106,200 |
|
273 |
Columbus-Starkville-West Point, MS |
101,700 |
|
274 |
Elkins-Buckhannon-Weston, WV |
101,600 |
|
274 |
Williamsport, PA |
101,600 |
|
276 |
Mankato-New
Ulm-St. Peter, MN |
101,300 |
|
276 |
Sioux City,
IA |
101,300 |
|
278 |
Harrisonburg, VA |
100,900 |
|
279 |
Rapid City,
SD |
99,900 |
|
280 |
Sheboygan,
WI |
99,200 |
|
281 |
Watertown,
NY |
95,300 |
|
282 |
Lewiston-Auburn, ME |
93,200 |
|
283 |
Decatur, IL |
91,600 |
|
284 |
Bluefield,
WV |
91,200 |
|
285 |
Ithaca, NY |
90,400 |
|
286 |
Bismarck,
ND |
89,100 |
|
287 |
Lawton, OK |
87,700 |
|
288 |
Cookeville,
TN |
87,500 |
|
289 |
Sebring, FL |
87,000 |
|
290 |
San Angelo,
TX |
85,800 |
|
291 |
Hot
Springs, AR |
83,800 |
|
292 |
Grand
Forks, ND-MN |
83,600 |
|
293 |
Jackson, TN |
81,400 |
|
294 |
Jonesboro,
AR |
75,300 |
|
295 |
Cheyenne,
WY |
72,800 |
|
296 |
Beckley, WV |
69,100 |
|
297 |
Mason City,
IA |
68,200 |
|
298 |
Clovis, NM |
66,300 |
|
299 |
Brunswick,
GA |
63,300 |
|
300 |
Meridian,
MS |
62,800 |
|
301 |
Casper, WY |
60,700 |
|
302 |
Aspen, CO |
57,800 |
|
|
|
|